Use this file to discover all available pages before exploring further.
How do I configure Scraping Browser to work from a specific country?
When using the Scraping Browser, the same country-targeting parameter is available to use as in other Bright Data proxy products.Specific countryWhen setting up your script, add the -country flag, after your USER credentials within the Bright Data endpoint, followed by the 2-letter ISO code for that country.For example, Scraping Browser using Puppeteer in the USA:
EU regionEU region
You can target the entire European Union region in the same manner as “Country” above by adding “eu” after “country” in your request: “-country-eu”. Requests sent using -country-eu, will use IPs from one of the countries below which are included automatically within “eu”: AL, AZ, KG, BA, UZ, BI, XK, SM, DE, AT, CH, UK, GB,IE, IM, FR, ES, NL, IT, PT, BE, AD, MT, MC, MA, LU, TN, DZ, GI, LI, SE, DK, FI, NO, AX, IS, GG, JE, EU, GL, VA, FX, FO.Need Scraping Browser to target a specific geographical radius of proxies?Check out our Proxy.setLocation/scraping-automation/scraping-browser/features/proxy-location) feature.
Which programming languages, libraries, and browser automation tools are supported by Scraping Browser?
Bright Data’s Scraping Browser is compatible with a wide variety of programming languages, libraries, and browser automation tools, offering full native support for Node.js, Python, and Java/C# using puppeteer, playwright, and selenium respectively.Other languages can usually be integrated as well via the third-party libraries listed below, enabling you to incorporate Scraping Browser directly into your existing tech stack.
Language/Platform
puppeteer
playwright
selenium
Python
N/A
*playwright-python
*Selenium WebDriver
JS / Node
*Native
*Native
*WebDriverJS
Java
Puppeteer Java
Playwright for Java
*Native
Ruby
Puppeteer-Ruby
playwright-ruby-client
Selenium WebDriver for Ruby
C#
*.NET: Puppeteer Sharp
Playwright for .NET
*Selenium WebDriver for .NET
Go
chromedp
playwright-go
Selenium WebDriver for Go
*Full support
How can I debug what's happening behind the scenes during my Scraping Browser session?
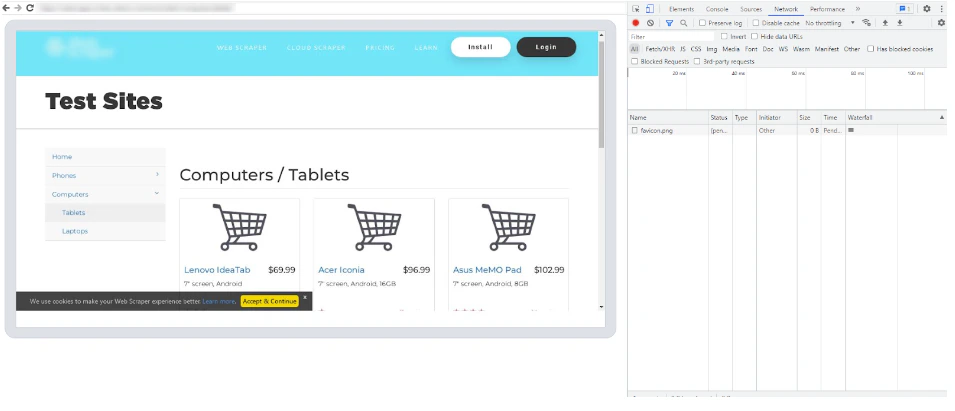
You can see in real-time what the Scraping Browser is doing on your local machine. This is similar to using setting headless browser to ‘FALSE’ on Puppeteer.Web scraping projects often require intricate interactions with target websites and debugging is vital for identifying and resolving issues found during the development process.The Scraping Browser Debugger serves as a valuable resource, enabling you to inspect, analyze, and fine-tune your code alongside Chrome Dev Tools, resulting in better control, visibility, and efficiency.
Where do I find the Scraping Browser Debugger?
You can see in real-time what the Scraping Browser is doing on your local machine. This is similar to using setting headless browser to ‘FALSE’ on Puppeteer.Our Scraping Browser Debugger can be launched via two methods: Manually via Control Panel OR Remotely via your script.
via Control Panel
via Code (remote)
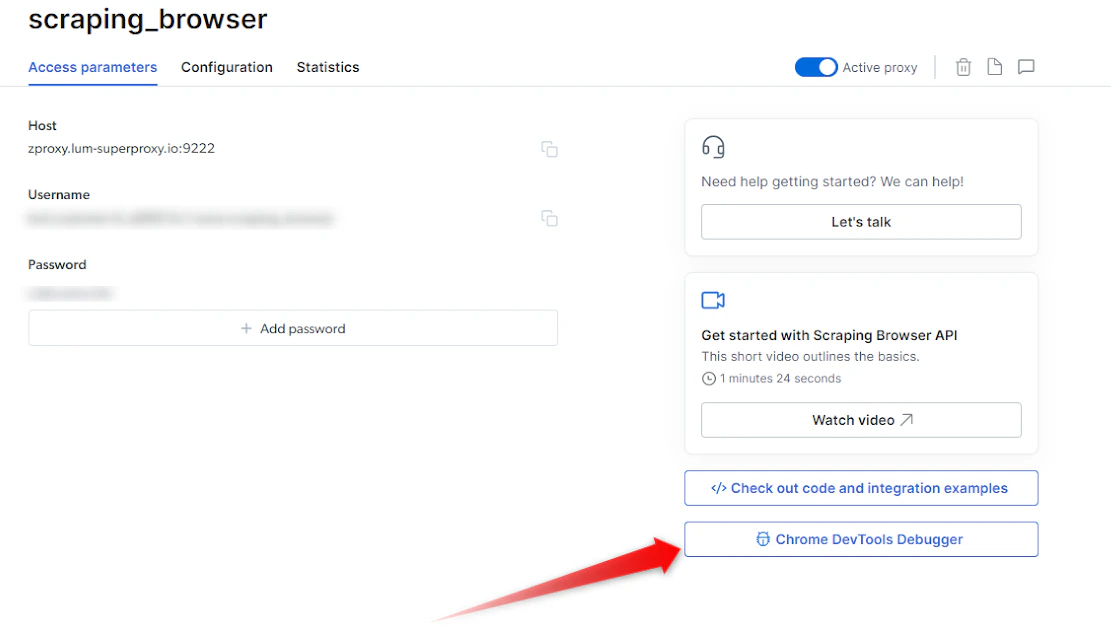
The Scraping Browser Debugger can be easily accessed within your Bright Data Control Panel. Follow these steps:
On the right side, Click on the “Chrome Dev Tools Debugger” button
Getting Started with the Debugger & Chrome Dev Tools
1
Open a Scraping Browser Session
Ensure you have an active Scraping Browser session
If you don’t yet know how to launch a scraping browser session, see our Quick Start guide.
2
Launch the Debugger
Once your session is up and running you can now launch the Debugger.
Click on the Debugger button within your Overview tab to launch the Scraping Browser Debugger interface (see the screenshot above )
3
Connect with your live browser sessions
Within the Debugger interface, you will find a list of your live Scraping Browser sessions.
Select the preferred session that you wish to debug
Click on the session link or copy/paste it into your browser of choice, and this will establish a connection between the Debugger and your selected session.
To access and launch the debugger session directly from your script, you’ll need to send the CDP command: Page.inspect.
With the Scraping Browser Debugger now connected to your live session, you gain access to the powerful features of Chrome Dev Tools.
Utilize the Dev Tools interface to inspect HTML elements, analyze network requests, debug JavaScript code, and monitor performance. Leverage breakpoints, console logging, and other debugging techniques to identify and resolve issues within your code.
How to automatically launch devtools locally to view your live browser session?
If you would like to automatically launch devtools on every session to view your live browser session, you can integrate the following code snippet:
NodeJS - Puppeteer
// Node.js Puppeteer - launch devtools locally const { exec} = require('child_process');const chromeExecutable = 'google-chrome';const delay = ms => new Promise(resolve => setTimeout(resolve, ms));const openDevtools = async (page, client) => { // get current frameId const frameId = page.mainFrame()._id; // get URL for devtools from scraping browser const { url: inspectUrl } = await client.send('Page.inspect', { frameId }); // open devtools URL in local chrome exec(`"${chromeExecutable}" "${inspectUrl}"`, error => { if (error) throw new Error('Unable to open devtools: ' + error); }); // wait for devtools ui to load await delay(5000);};const page = await browser.newPage();const client = await page.target().createCDPSession();await openDevtools(page, client);await page.goto('http://example.com');
Debugger WalkthroughCheck out the Scraping Browser Debugger in action below<inser-video-here>
How can I see a visual of what's happening in the browser?
Triggering a screenshot
Launch devtools locally
You can easily trigger a screenshot of the browser at any time by adding the following to your code:
Why does the initial navigation for certain pages take longer than others?
There is a lot of “behind the scenes” work that goes into unlocking your targeted site.Some sites will take just a few seconds for navigation, while others might take even up to a minute or two as they require more complex unlocking procedures. As such, we recommend setting your navigation timeout to “2 minutes” to give the navigation enough time to succeed if needed.You can set your navigation timeout to 2 minutes by adding the following line in your script before your “page.goto” call.
// node.js puppeteer - Navigate to site with 2 min timeout
page.goto('<https://example.com>', { timeout: 2*60*1000 });
What are the most Common Error codes?
Error Code
Meaning
What can you do about it?
Unexpected server response: 407
An issue with the remote browser’s port
Please check your remote browser’s port. The correct port for Scraping Browser is port:9222
Unexpected server response: 403
Authentication Error
Check authentication credentials (username, password) and check that you are using the correct “Browser API” zone from Bright Data control panel
Unexpected server response: 503
Service Unavailable
We are likely scaling browsers right now to meet demand. Try to reconnect in 1 minute.
I can't seem to establish a connection with Scraping Browser, do I have a connection issue?
If you’re experiencing connection issues, you can test your local Scraping Browser connection with a simple curl to the following endpoint:
Check your authentication details from your Scraping Browser zone, and ensure the USER and PASS values are correct.
Verify network Configuration: Confirm your network and/or firewall is not blocking outbound connections to https://brd.superproxy.io:9222.
If the issue persists, please contact support for further assistance.
How to Integrate Scraping Browser with .NET Puppeteer Sharp?
Integration with the Scraping browser product with C# requires patching the PuppeteerSharp library to add support for websocket authentication. This can be done like the following:
C# PuppeteerSharp
using PuppeteerSharp;
using System.Net.WebSockets;
using System.Text;

// Set the authentication credentials
var auth = "SBR_ZONE_FULL_USERNAME:SBR_ZONE_PASSWORD";
// Construct the WebSocket URL with authentication
var ws = $"wss://{auth}@brd.superproxy.io:9222";
// Custom WebSocket factory function
async Task<WebSocket> ws_factory(Uri url, IConnectionOptions options, CancellationToken cancellationToken)

{
    // Create a new ClientWebSocket instance
    var socket = new ClientWebSocket();
    // Extract the user information (username and password) from the URL
    var user_info = url.UserInfo;
    if (user_info != "")
    {
        // Encode the user information in Base64 format
        var auth = Convert.ToBase64String(Encoding.Default.GetBytes(user_info));
        // Set the "Authorization" header of the WebSocket options with the encoded credentials
        socket.Options.SetRequestHeader("Authorization", $"Basic {auth}");
    }

    // Disable the WebSocket keep-alive interval
    socket.Options.KeepAliveInterval = TimeSpan.Zero;
    // Connect to the WebSocket endpoint
    await socket.ConnectAsync(url, cancellationToken);
    return socket;
}

// Create ConnectOptions and configure the options
var options = new ConnectOptions()

{
    // Set the BrowserWSEndpoint to the WebSocket URL
    BrowserWSEndpoint = ws,
    // Set the WebSocketFactory to the custom factory function
    WebSocketFactory = ws_factory,
};

// Connect to the browser using PuppeteerSharp
Console.WriteLine("Connecting to browser...");

using (var browser = await Puppeteer.ConnectAsync(options))
{
    Console.WriteLine("Connected! Navigating...");
    // Create a new page instance
    var page = await browser.NewPageAsync();
    // Navigate to the specified URL
    await page.GoToAsync("https://example.com");
    Console.WriteLine("Navigated! Scraping data...");
    // Get the content of the page
    var content = await page.GetContentAsync();
    Console.WriteLine("Done!");
    Console.WriteLine(content);
}
Which coding languages does Scraping Browser support?
Bright Data’s Scraping Browser supports a wide range of programming languages and libraries. We currently have full native support for Node.js and Python using puppeteer, playwright, and selenium, and other languages can be integrated as well using the other libraries below, giving you the flexibility to integrate Scraping Browser right into your current tech stack.
Language/Platform
puppeteer
playwright
selenium
Python
N/A
playwright-python
Selenium WebDriver
JS / Node
Native support
Native support
WebDriverJS
Java
Puppeteer Java
Playwright for Java
Native support
Ruby
Puppeteer-Ruby
playwright-ruby-client
Selenium WebDriver for Ruby
C#
.NET: Puppeteer Sharp
Playwright for .NET
Selenium WebDriver for .NET
Go
chromedp
playwright-go
Selenium WebDriver for Go
How can I debug what's happening behind the scenes during my Scraping Browser session?
You can see in real-time what the Scraping Browser is doing on your local machine. This is similar to using setting headless browser to ‘FALSE’ on Puppeteer.Web scraping projects often require intricate interactions with target websites and debugging is vital for identifying and resolving issues found during the development process.The Scraping Browser Debugger serves as a valuable resource, enabling you to inspect, analyze, and fine-tune your code alongside Chrome Dev Tools, resulting in better control, visibility, and efficiency.
Where do I find the Scraping Browser Debugger?
You can see in real-time what the Scraping Browser is doing on your local machine. This is similar to using setting headless browser to ‘FALSE’ on Puppeteer.Our Scraping Browser Debugger can be launched via two methods: Manually via Control Panel OR Remotely via your script.
via Control Panel
via Code (remote)
The Scraping Browser Debugger can be easily accessed within your Bright Data Control Panel. Follow these steps:
On the right side, Click on the “Chrome Dev Tools Debugger” button
Getting Started with the Debugger & Chrome Dev Tools
1
Open a Scraping Browser Session
Ensure you have an active Scraping Browser session
If you don’t yet know how to launch a scraping browser session, see our Quick Start guide.
2
Launch the Debugger
Once your session is up and running you can now launch the Debugger.
Click on the Debugger button within your Overview tab to launch the Scraping Browser Debugger interface (see the screenshot above )
3
Connect with your live browser sessions
Within the Debugger interface, you will find a list of your live Scraping Browser sessions.
Select the preferred session that you wish to debug
Click on the session link or copy/paste it into your browser of choice, and this will establish a connection between the Debugger and your selected session.
To access and launch the debugger session directly from your script, you’ll need to send the CDP command: Page.inspect.
With the Scraping Browser Debugger now connected to your live session, you gain access to the powerful features of Chrome Dev Tools.
Utilize the Dev Tools interface to inspect HTML elements, analyze network requests, debug JavaScript code, and monitor performance. Leverage breakpoints, console logging, and other debugging techniques to identify and resolve issues within your code.
How to automatically launch devtools locally to view your live browser session?
If you would like to automatically launch devtools on every session to view your live browser session, you can integrate the following code snippet:
NodeJS - Puppeteer
// Node.js Puppeteer - launch devtools locally const { exec} = require('child_process');const chromeExecutable = 'google-chrome';const delay = ms => new Promise(resolve => setTimeout(resolve, ms));const openDevtools = async (page, client) => { // get current frameId const frameId = page.mainFrame()._id; // get URL for devtools from scraping browser const { url: inspectUrl } = await client.send('Page.inspect', { frameId }); // open devtools URL in local chrome exec(`"${chromeExecutable}" "${inspectUrl}"`, error => { if (error) throw new Error('Unable to open devtools: ' + error); }); // wait for devtools ui to load await delay(5000);};const page = await browser.newPage();const client = await page.target().createCDPSession();await openDevtools(page, client);await page.goto('http://example.com');
Debugger WalkthroughCheck out the Scraping Browser Debugger in action below<inser-video-here>
How can I see a visual of what's happening in the browser?
Triggering a screenshot
You can easily trigger a screenshot of the browser at any time by adding the following to your code:
Why does the initial navigation for certain pages take longer than others?
There is a lot of “behind the scenes” work that goes into unlocking your targeted site.Some sites will take just a few seconds for navigation, while others might take even up to a minute or two as they require more complex unlocking procedures. As such, we recommend setting your navigation timeout to “2 minutes” to give the navigation enough time to succeed if needed.You can set your navigation timeout to 2 minutes by adding the following line in your script before your “page.goto” call.
// node.js puppeteer - Navigate to site with 2 min timeout
page.goto('<https://example.com>', { timeout: 2*60*1000 });
What are the most Common Error codes?
Error Code
Meaning
What can you do about it?
Unexpected server response: 407
An issue with the remote browser’s port
Please check your remote browser’s port. The correct port for Scraping Browser is port:9222
Unexpected server response: 403
Authentication Error
Check authentication credentials (username, password) and check that you are using the correct “Browser API” zone from Bright Data control panel
Unexpected server response: 503
Service Unavailable
We are likely scaling browsers right now to meet demand. Try to reconnect in 1 minute.
How to Integrate Scraping Browser with .NET Puppeteer Sharp?
Integration with the Scraping browser product with C# requires patching the PuppeteerSharp library to add support for websocket authentication. This can be done like the following:
C# PuppeteerSharp
using PuppeteerSharp;
using System.Net.WebSockets;
using System.Text;

// Set the authentication credentials
var auth = "SBR_ZONE_FULL_USERNAME:SBR_ZONE_PASSWORD";
// Construct the WebSocket URL with authentication
var ws = $"wss://{auth}@zproxy.lum-superproxy.io:9222";
// Custom WebSocket factory function
async Task<WebSocket> ws_factory(Uri url, IConnectionOptions options, CancellationToken cancellationToken)

{
    // Create a new ClientWebSocket instance
    var socket = new ClientWebSocket();
    // Extract the user information (username and password) from the URL
    var user_info = url.UserInfo;
    if (user_info != "")
    {
        // Encode the user information in Base64 format
        var auth = Convert.ToBase64String(Encoding.Default.GetBytes(user_info));
        // Set the "Authorization" header of the WebSocket options with the encoded credentials
        socket.Options.SetRequestHeader("Authorization", $"Basic {auth}");
    }

    // Disable the WebSocket keep-alive interval
    socket.Options.KeepAliveInterval = TimeSpan.Zero;
    // Connect to the WebSocket endpoint
    await socket.ConnectAsync(url, cancellationToken);
    return socket;
}

// Create ConnectOptions and configure the options
var options = new ConnectOptions()

{
    // Set the BrowserWSEndpoint to the WebSocket URL
    BrowserWSEndpoint = ws,
    // Set the WebSocketFactory to the custom factory function
    WebSocketFactory = ws_factory,
};

// Connect to the browser using PuppeteerSharp
Console.WriteLine("Connecting to browser...");

using (var browser = await Puppeteer.ConnectAsync(options))
{
    Console.WriteLine("Connected! Navigating...");
    // Create a new page instance
    var page = await browser.NewPageAsync();
    // Navigate to the specified URL
    await page.GoToAsync("https://example.com");
    Console.WriteLine("Navigated! Scraping data...");
    // Get the content of the page
    var content = await page.GetContentAsync();
    Console.WriteLine("Done!");
    Console.WriteLine(content);
}
Can I choose the country that the Scraping Browser will scrape from?
This is possible, but not recommended. The reason is that the Scraping Browser utilises Bright Data’s full suite of unblocking capabilities which automatically chooses the best IP type and location to get you the page you want to access.In case you still want to make the Scraping Browser work from a specific country, simply use the username that includes the country-xx in the configuration.See the example below for Puppeteer: We added -country-us to our request, so we will send a request originating from the United States (“us”).const SBR_WS_ENDPOINT = 'wss://brd-customer-<customer_id>-zone-<zone_name>-country-us:<password>@brd.superproxy.io:9222'
How does the Scraping Browser pricing work?
Scraping Browser pricing is simple: you only pay for gigabytes of traffic that you transferred through the Scraping Browser.There is no cost for instances or time using the Scraping Browsers - only traffic.It doesn’t matter what country you are using, traffic is billed at the same rates. Because you pay by traffic, you probably will want to minimize it.The only exception to this is premium domains, which cost more per gigabyte, because Bright Data needs to invest a significantly higher amount of effort and resources to unblock. You can find more information about premium domains in your Scraping Browser configuration pages.
Is password typing allowed with Scraping Browser?
Bright Data is committed to collecting only publicly available data. To uphold this commitment, Scraping Browser is configured by default to prevent any attempts to log in to accounts by disabling password entry. This restriction helps ensure that no non-public data—including any data accessible only behind a login—is scraped. For your reference, please review our Acceptable Use Policy at https://brightdata.com/acceptable-use-policy .In certain cases, it may be possible to override this default block. If you require an exception, you must first complete our Know-Your-Customer (KYC) process available at https://brightdata.com/cp/kyc. Once you have completed the process, please contact our compliance department directly at compliance@brightdata.com to submit your request (you could also request the permissions during your KYC process).